Nifty Premium Decay: How Theta Bleeds Your Option
Nifty premium decay is the daily tax every option buyer pays and seller earns. See how theta accelerates near expiry and three setups to trade around it.

Every option buyer has had this moment. You take a Nifty call on Monday, the index drifts sideways for three days, and by Thursday afternoon your ₹180 premium is worth ₹95 — even though spot hasn’t moved. Nobody took anything from you. The option just bled.
That bleed has a name: option premium decay, measured by the Greek letter theta. It’s the silent tax every option buyer pays and the silent income every option seller collects. This post walks through what decay actually is, how it’s calculated with real Nifty numbers, and three ways traders structure positions around it.
What is option premium decay, really?
An option’s price has two parts: intrinsic value (how deep it’s in the money) and extrinsic value (everything else). Premium decay chips away at the extrinsic part.
Think of it like a melting ice cube on a warm day. The shape (intrinsic value) might look the same for a while, but the mass is leaking every second. By the time expiry arrives, the extrinsic portion has melted completely — zero. What’s left is whatever intrinsic value the strike finishes with, if any.
In one line: premium decay is the rate at which your option loses its time value as the clock ticks toward expiry. Theta is the daily rupee number that tells you exactly how fast.
Sellers love this because decay flows to their P&L automatically, even if the underlying does absolutely nothing. Buyers hate it because they need direction and speed; sitting and waiting is the worst thing they can do.
How premium decay is calculated
Theta is derived from the Black-Scholes model, but you don’t need the equation; option chains quote it directly. What matters is understanding the shape of the decay.
The curve is non-linear. Premium doesn’t bleed ₹1 a day for 30 days straight; it bleeds slowly at first and violently at the end. Mathematically, extrinsic value is roughly proportional to the square root of time remaining. Cut the time in half and you don’t lose half the premium. You lose about 30%. But cut the time to one-quarter and you’ve already lost 50%+.
This is why the last week of an option’s life is the most dangerous for buyers and the most profitable for sellers.
A simple example on current Nifty
Nifty spot at the time of writing: 23,976. Current weekly expiry: 28 April 2026 (Tuesday, four trading days out). The 24,000 strike is effectively ATM.
Here’s what the chain shows right now:
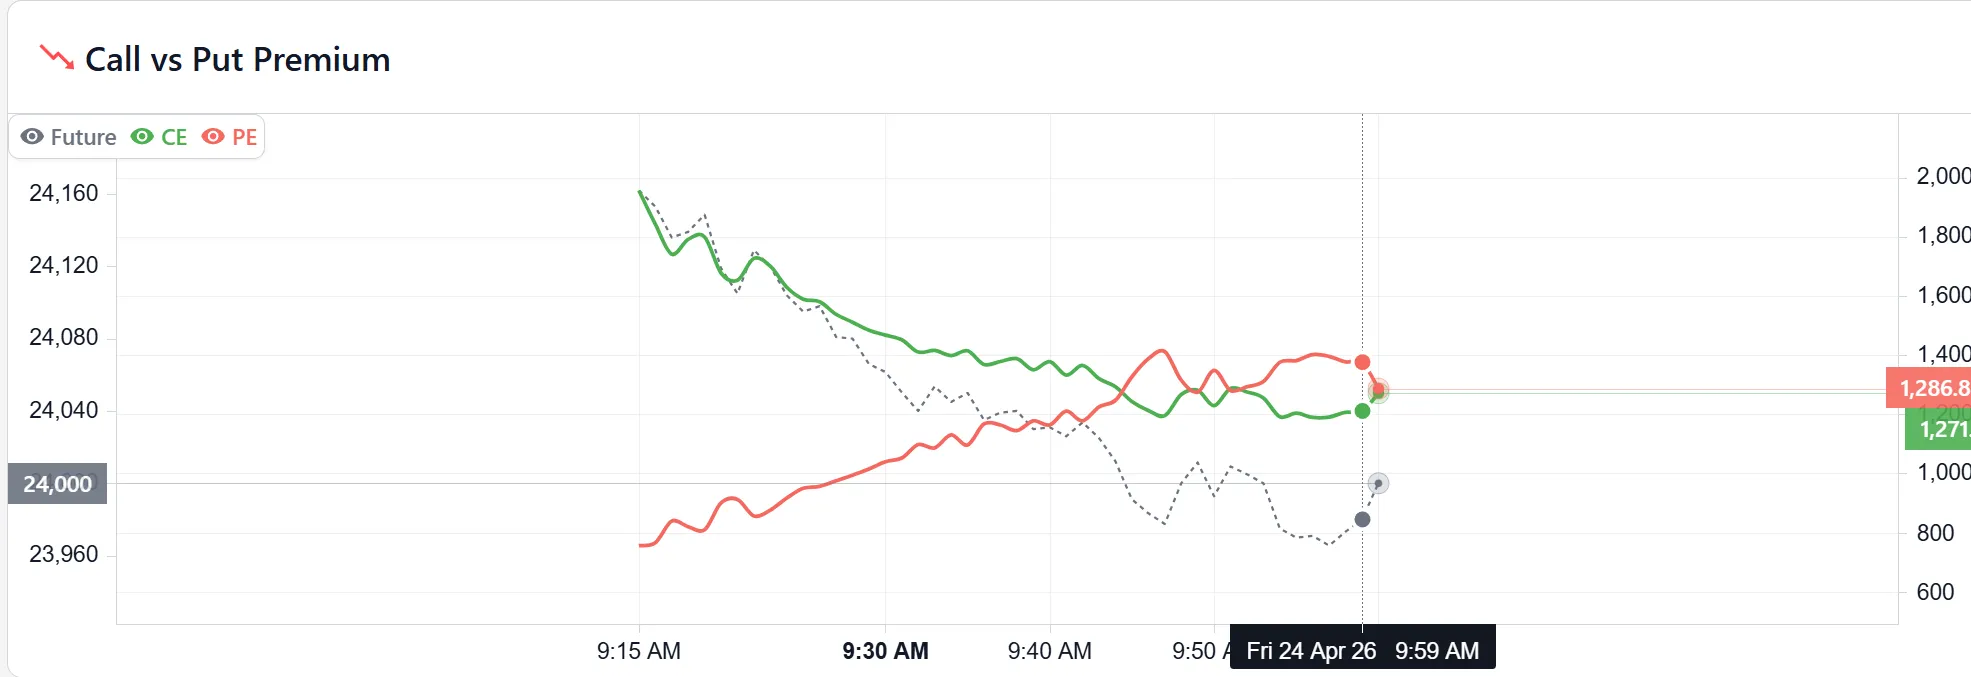
- 24,000 CE premium: ₹1,271
- 24,000 PE premium: ₹1,287
With roughly 4 trading days to expiry, the implied theta on a near-the-money weekly option works out to a meaningful daily bleed. Watch the session today — the CE is already showing a change of ₹-686 from yesterday’s close, meaning more than half the remaining extrinsic value has drained in a single day as the market leaned toward the put side.
Multiply that by the Nifty lot size (75 contracts per lot in the current regime) and the rupee impact is sharp. A single lot long on the 24,000 CE this morning would be sitting on a five-figure loss purely from decay and intraday drift. That’s what “premium decay” looks like on a live chain.
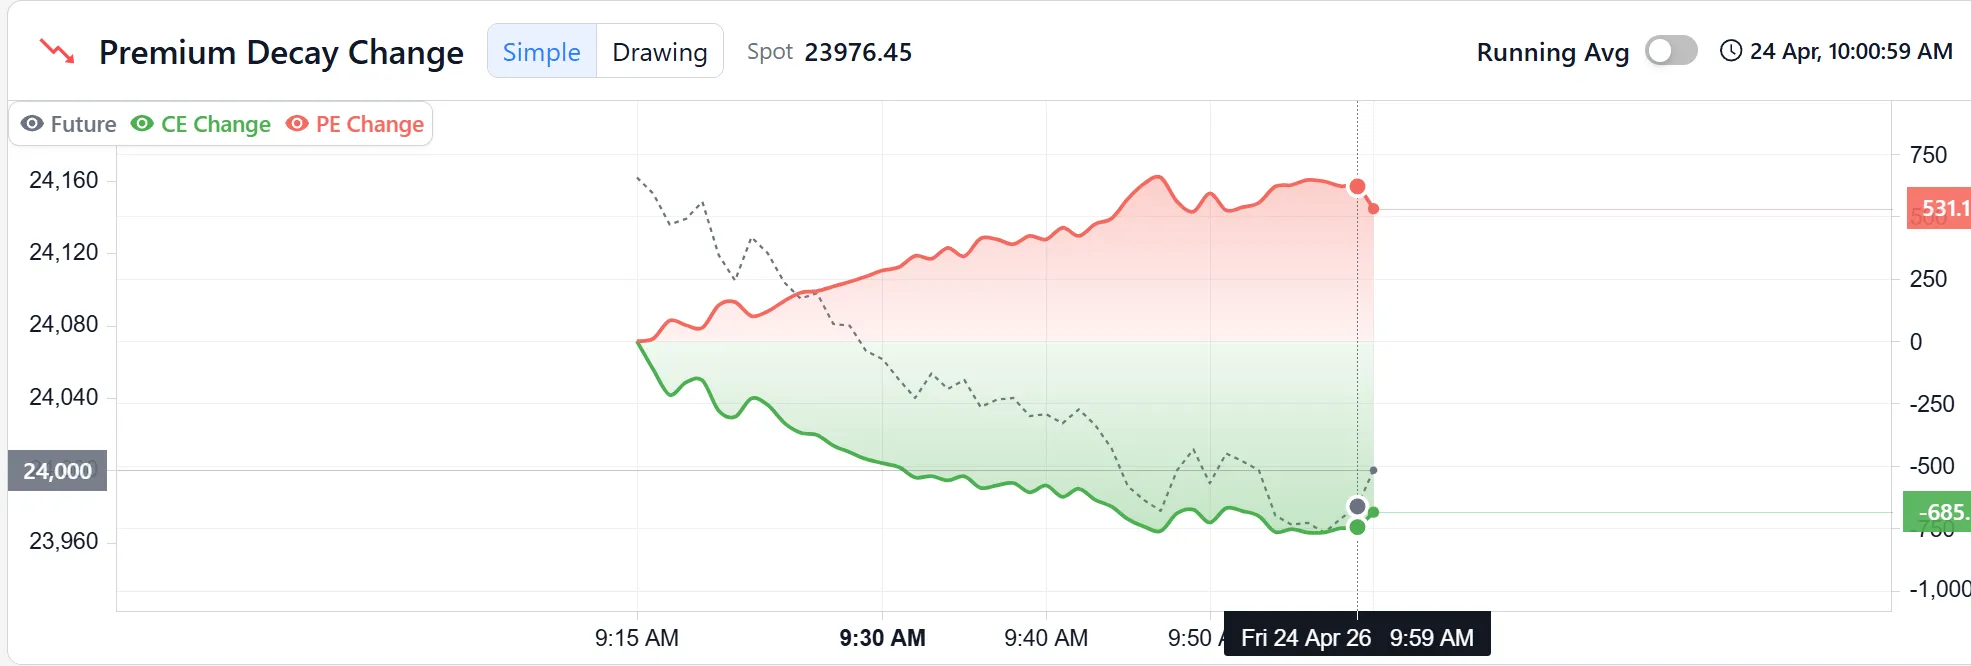
How to read the premium decay chart
The live Premium Decay chart on stockmojo.in plots the intraday erosion for both the call and put side. You pick a symbol, an expiry, and how many strikes around ATM you want to see. The chart redraws minute by minute.
Three things to notice when you open the tool:
- The shape of the curves. On expiry day itself, both lines slope aggressively downward from 11 AM onward. On a T-2 day, the slope is gentler but still unmistakable.
- The asymmetry. Call-side and put-side decay rarely match. If one side is shedding value faster, that’s a directional tell: the market is quietly pricing in a bias.
- The acceleration points. Around 1:30–2:30 PM, decay visibly steepens. Market-makers reprice the remaining time value as the close approaches; buyers of tail-risk options are the ones feeding that reprice.
Below the main chart, the tool stacks a Call vs Put Premium panel that overlays both absolute premiums on one view. That second chart is the one to screenshot if you’re reviewing a trade later — you’ll see exactly where the decay accelerated and where it paused.
Trading with premium decay — 3 practical setups
1. Expiry-day ATM straddle short
This is the canonical theta trade in the Indian market. Sell the ATM call and the ATM put simultaneously on expiry day morning, usually around 9:30 AM once the opening volatility settles. Collect the combined premium. Exit when theta has done its work, typically by 2:30 PM with a target of 60–70% of premium captured.
The risk is gamma. If Nifty breaks out of your sold strikes, your loss accelerates as fast as your theta gains were. Size accordingly — a stop-loss of 40–50% of premium collected keeps the trade survivable. On the 24,000 straddle today, combined premium is around ₹2,560; a full lot entry needs roughly ₹60,000–80,000 of margin and the sized stop would be at ₹3,600.
2. Calendar spread — sell the front, buy the back
Sell the current-week expiry, buy the next-month expiry at the same strike. The front leg decays fast, the back leg decays slowly. Net theta is positive and delta is near-zero at entry. This is a lower-octane cousin of the straddle short: less gamma risk, smaller daily theta.
The setup works best when IV is in the middle of its range. At very high IV, the back leg decays faster than you’d want. At very low IV, both legs decay slowly and the trade just sits.
3. Avoiding the T-2 buy trap
This one is about not making a trade. New option buyers routinely pick up a cheap OTM call two days before expiry because “it’s only ₹20, what’s the downside.” The downside is that the same ₹20 becomes ₹3 by tomorrow’s close if the index doesn’t move. T-2 decay is the fastest part of the curve; buying into it is paying full price for 20% of the asset.
If you must buy options in expiry week, at least move to slightly ITM strikes — they have intrinsic value that doesn’t decay. Or structure the trade as a debit spread so theta doesn’t eat you alive on one leg.
What premium decay doesn’t tell you
Decay charts are backward-looking. They tell you what happened to premium so far; they can’t predict a volatility spike that resets everything.
A few edge cases to keep in the back of your mind:
- Event-driven IV crush overwhelms theta. On the day of an RBI policy or a Union Budget, premium often drops 30–40% the moment the event concludes, regardless of where spot sits. That’s IV crush, not theta, and it hits even options with weeks to expiry.
- Theta is not constant intraday. The textbook treats theta as a daily number, but on expiry day it compresses into hours. A 9:30 AM theta looks nothing like a 2:30 PM theta for the same strike.
- Deep OTM strikes can re-inflate. A 0.05 delta option can briefly gain premium if implied volatility jumps on news, completely counter to the decay curve. Don’t assume theta is a one-way street at every strike.
- Lot-size arithmetic is everything. Theta quoted per contract looks harmless: ₹3, ₹7, ₹12. Multiply by 75 (Nifty lot) and that daily decay becomes ₹225, ₹525, ₹900 per lot. Always convert theta to rupees per lot before sizing.
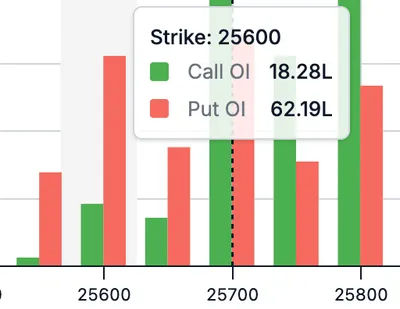
For a closer look at how open interest confirms or contradicts the story the decay chart tells, see our deep-dive on open interest in options. And when you’re trying to figure out where the decay is pinning the index on expiry day, the max pain in Nifty options post explains the magnet effect that often decides the final print.
Bottom line
Premium decay isn’t a technical pattern you hunt for on a chart — it’s the background rate at which every option is dying. Buyers are fighting it; sellers are collecting it. Understanding the shape of the curve (slow early, brutal late) and where your strike sits on it is the difference between random directional punts and a repeatable options edge.
You can track live premium decay for every Nifty expiry here.
Disclaimer: Derivatives trading involves substantial risk of loss and isn’t suitable for every investor. Past behaviour of any indicator is no guarantee of future results. Do your own research and consult a SEBI-registered advisor before acting on anything here.
Frequently asked questions
- 01 Is premium decay the same as theta?
- Functionally yes. Theta is the Greek that measures premium decay per day — the number you see quoted on any option-chain screen. 'Premium decay' is the plain-English description of what theta actually does: it shaves rupees off your option's extrinsic value as time passes, regardless of where the underlying goes.
- 02 How much does a Nifty option premium decay on expiry day?
- ATM Nifty options routinely lose 50–80% of their morning premium by the 3:30 PM close, even when the index barely moves. Deep OTM strikes can drop 90%+ in the same session. This is why expiry day is the steepest part of the theta curve and why short-premium traders structure entire strategies around it.
- 03 Why does premium decay accelerate in the last week?
- Extrinsic value is proportional to the square root of time remaining. When time drops from 30 days to 7, the premium doesn't just drop linearly — the curve steepens. An option that loses ₹3 a day a month before expiry can lose ₹12 a day three days before, purely from the shape of the time-value function.
- 04 Does theta decay happen over the weekend?
- Yes, but it's built into Friday's close. Market-makers mark down weekend theta on Friday afternoon so Monday's opening premium already reflects the two lost days. You won't see a visible 'gap-down' from theta on Monday morning — the decay is front-loaded into the Friday session.
- 05 Premium decay vs IV crush — what's the difference?
- Premium decay is the erosion from time passing. IV crush is the erosion from implied volatility dropping (typically after a known event like earnings or an RBI policy). Both reduce extrinsic value. Theta is predictable and daily; IV crush is sudden and event-driven. An option can suffer both simultaneously.
- 06 Can beginners use the premium decay chart?
- Yes — it's one of the more intuitive charts on the platform. You pick a strike and watch how its premium has eroded intraday. Beginners should start by comparing an ATM strike to a 1% OTM strike on expiry day; the difference in decay rate makes the concept stick faster than any textbook definition.